Is your site affected by Google Panda or Penguin updates? The Google penalty checker is a nifty tool to help you find out if your website was affected during different Google algorithmic Panda or Penguin updates.
Fruition has created the Google penalty checker, which compiles data from your Google analytics account, and compares the increase in traffic or site traffic drop with various Google penalty roll-out dates and is able to prepare a graphic visualization of your website traffic and its affect by Google penalty algorithms.
We have been fighting Panda for the last years and as Fruition allows a free account to check two websites, I jumped right in to try out the tool and to find possibly if we were affected by more Google penalties than we expected. Its great that it is not a limited version and has all the features you need. To check more domain names, you need to pay a fee and also get access to their API and support.
Check Google Penalty
First we created a free account in minutes. Its a good idea to use the same email as that of your Analytics account so it can grab the data easily. We chose the self service penalty check to get started. Then you need to authorize your Google Analytics account to let the penalty checker access data.
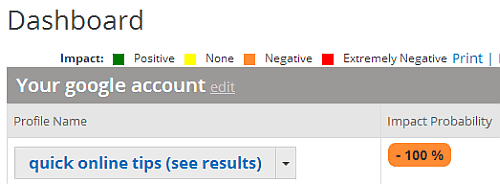
Then it will get access to ALL domains registered under your Analytics account. Remember you can access only 2 domains to use the free penalty checker account. We tried it on our website and indeed it revealed a huge penalty on the dashboard.

A quick click on the link and behold, it will compare all your site traffic drops and rises with the Google penalty dates, and give you a quick visualization chart as well as detailed date wise affect off Google penalty on your website.
Here is what our Google penalty chart looks like. As you can appreciate it’s full of red and orange dots, which signify negative and extremely negative impact of Google penalties on our website.

The green dots signify Positive Impact; Yellow dots mean No Impact; Orange dots mean Negative Impact while the red dots mean Extremely Negative Impact. I think there were more penalty updates than they chart, but then I think they have taken only the major confirmed updates into consideration.
While we liked to believe we were affected by only a few Panda or Penguin updates, these charts make it clear that the impact was much more than we expected and has been happening continuously for the last 2 years. I reviewed our Google Analytics after that, and indeed it matched the trends. Note the red dot signified our maximum traffic drop due to layout update). So basically since it is actually accessing your Analytics data, the result is mostly accurate.
While there has been continuous penalty hits for last few months, and it was difficulty to analyze by Analytics, the charts here are clear with all those orange alerts.

So if your site is hit by Google Panda and Penguin penalties, try this tool and you do not need a SEO expert to find out whats hitting your search engine rankings. [NB – No financial interest].
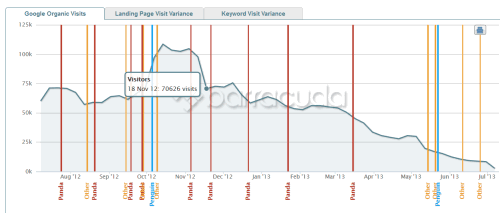
Update: Found another free tool by Barracuda called Panguin tool, which will again process your Google Analytics data, superimpose lines of Google algorithms updates and show keyword data as well. Here is what our chart looks like.
