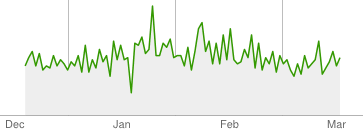
We got stuck by Google Panda update recently and was reviewing the Googlebot crawl stats for our site on Webmaster tools. We observed this new pattern of Googlebot crawls ever since Panda struck and wiped out our search engine traffic significantly.
Presumably it was due to the new Google Algorithm which penalized sites with heavy ads above-the-fold, which might have been the cause, but there are no recovery signs yet. Traffic continues to drop and we continue to bring you latest Panda updates.
Googlebot Crawl Patterns
View these charts from the last 90 days. Google Panda struck around Late January.
Pages crawled per day

If you observe carefully you note that there is no change in pages crawled per day, so Googlebot continue to effectively crawl all webpages (though we have deleted nearly 1000 pages of thin content!).
Time spent downloading a page

Time spent downloading a page is also same as before, which is actually not same as site speed time (as we have made our site faster by 100% since then), as Googlebot fetches the site code and is not bothered with loading scripts etc.
Kilobytes downloaded per day

What has changed is Kilobytes downloaded per day, which has significantly reduced since the day Panda struck. So effectively Googlebot is now downloading less than half of what it used to download earlier. Also note the weekly pattern is not regular as it was earlier. And the irregular pattern increased a few weeks before Panda striked the site.
If Google Panda crashed your site traffic, do you notice a similar Googlebot pattern? How do you interpret these charts?