Google Trends : Plotting Google Web Searches
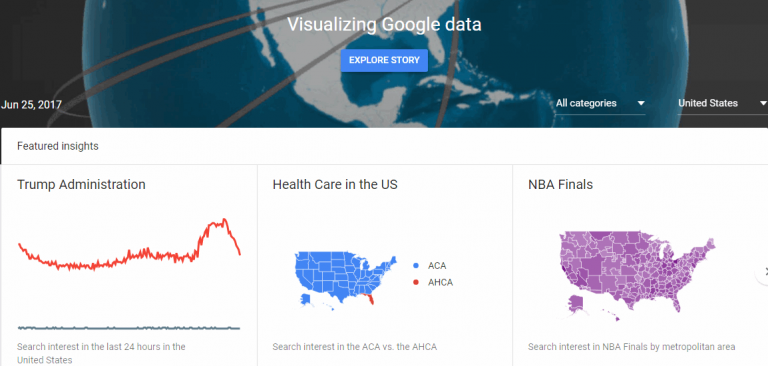
Google Trends launched today and lets you compare the world’s interest in your favorite topics. Enter up to five topics and see how often they’ve been searched for on Google over time. Google Trends also displays how frequently your topics have appeared in Google News stories, and which geographic regions have searched for them most often. Google Trends builds on the Google Zeitgeist to help users find facts and trends related to Google usage around the world.
Google Trends analyzes a portion of Google web searches to compute how many searches have been done for the terms you enter relative to the total number of searches done on Google over time. We then show you a graph with the results — our search-volume graph.
Located just beneath our search-volume graph is our news-volume graph. This graph shows you the number of times your topic appeared in Google News stories. When Google Trends detects a spike in the volume of news stories for a particular term, it labels the graph and displays the headline of an automatically selected Google News story written near the time of that spike.
This is an excellent addition to the huge list of Google Search tools. If you track Google Search trends, you might find the data really valuable and helpful.
Get our free weekly email: new tech guides and tools, no spam.
New and updated tech guides, a free tool worth bookmarking and one useful pick, once a week. No spam, unsubscribe anytime.
One email a week. Unsubscribe anytime. See our privacy policy.